library(lattice)
# 参考 lattice 书籍的图 6.5 的绘图代码
panel.3dcoastline <- function(..., rot.mat, distance, xlim, ylim, zlim,
xlim.scaled, ylim.scaled, zlim.scaled) {
scale.vals <- function(x, original, scaled) {
scaled[1] + (x - original[1]) * diff(scaled) / diff(original)
}
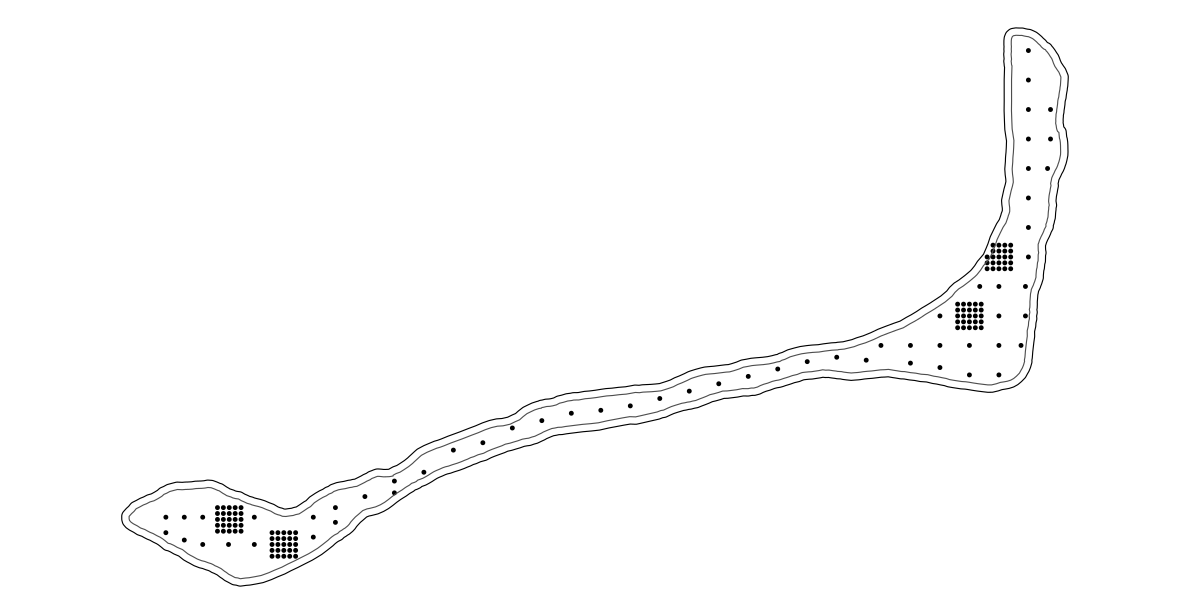
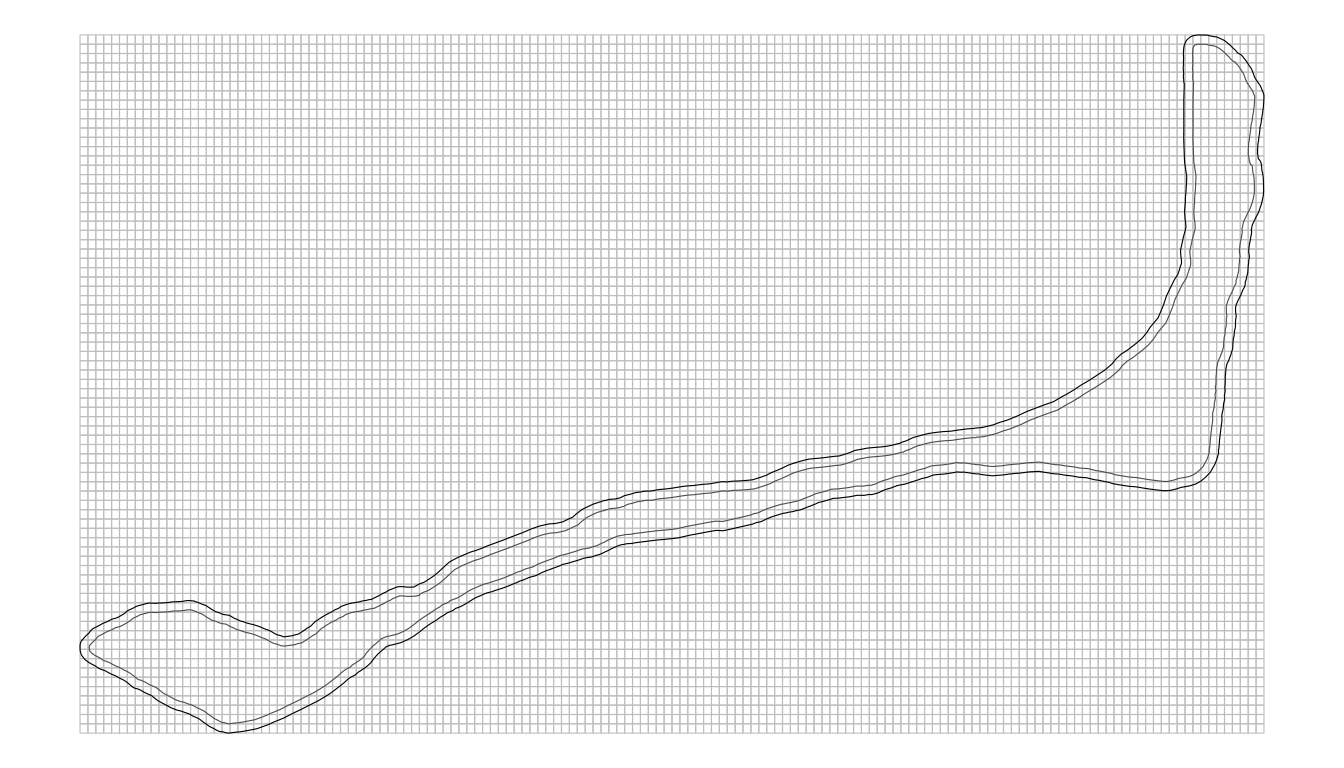
scaled.map <- rbind(
scale.vals(rongelap_coastline$cX, xlim, xlim.scaled),
scale.vals(rongelap_coastline$cY, ylim, ylim.scaled),
zlim.scaled[1]
)
m <- ltransform3dto3d(scaled.map, rot.mat, distance)
panel.lines(m[1, ], m[2, ], col = "black")
}
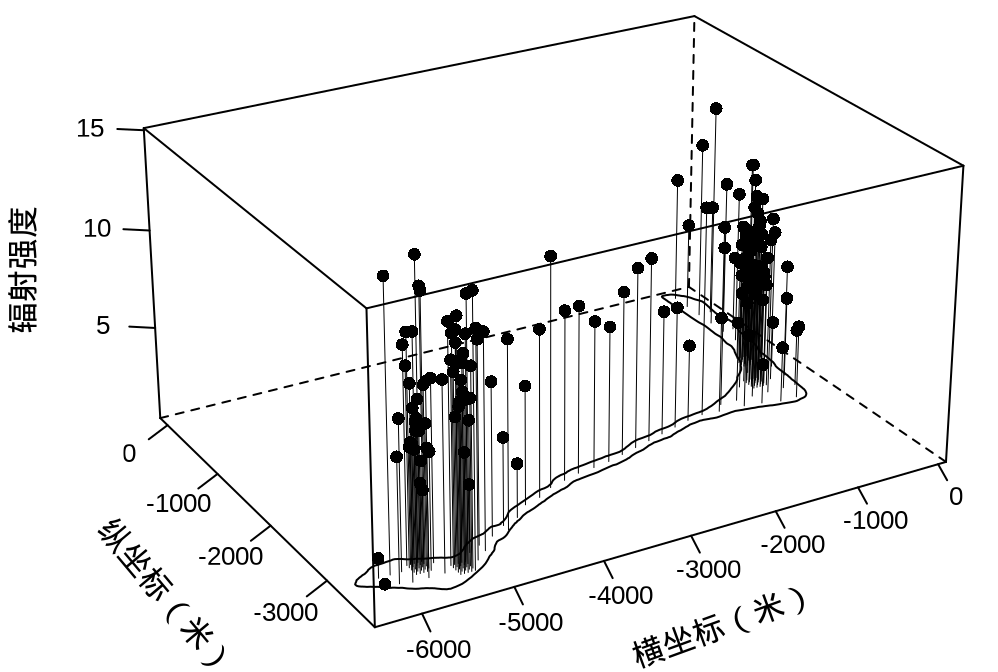
cloud(counts / time ~ cX * cY,
data = rongelap, col = "black",
xlim = c(-6500, 100), ylim = c(-3800, 150),
scales = list(arrows = FALSE, col = "black"),
aspect = c(0.75, 0.5),
xlab = list("横坐标(米)", rot = 20),
ylab = list("纵坐标(米)", rot = -50),
zlab = list("辐射强度", rot = 90),
type = c("p", "h"), pch = 16, lwd = 0.5,
panel.3d.cloud = function(...) {
panel.3dcoastline(...) # 海岸线
panel.3dscatter(...)
},
# 减少三维图形的边空
lattice.options = list(
layout.widths = list(
left.padding = list(x = -0.5, units = "inches"),
right.padding = list(x = -1.0, units = "inches")
),
layout.heights = list(
bottom.padding = list(x = -1.5, units = "inches"),
top.padding = list(x = -1.5, units = "inches")
)
),
par.settings = list(
# 移除几条内框线
# box.3d = list(col = c(1, 1, NA, NA, 1, NA, 1, 1, 1)),
# 刻度标签字体大小
axis.text = list(cex = 0.8),
# 去掉外框线
axis.line = list(col = "transparent")
),
# 设置三维图的观察方位
screen = list(z = 30, x = -65, y = 0)
)